Investor Market Analysis – 2026-05-19
Prime Property Funding Market Analysis for 2026-05-19. Current market conditions analyzed through the lens of financing costs, inventory dynamics, and return potential.
📊 Investor Snapshot – May 2026
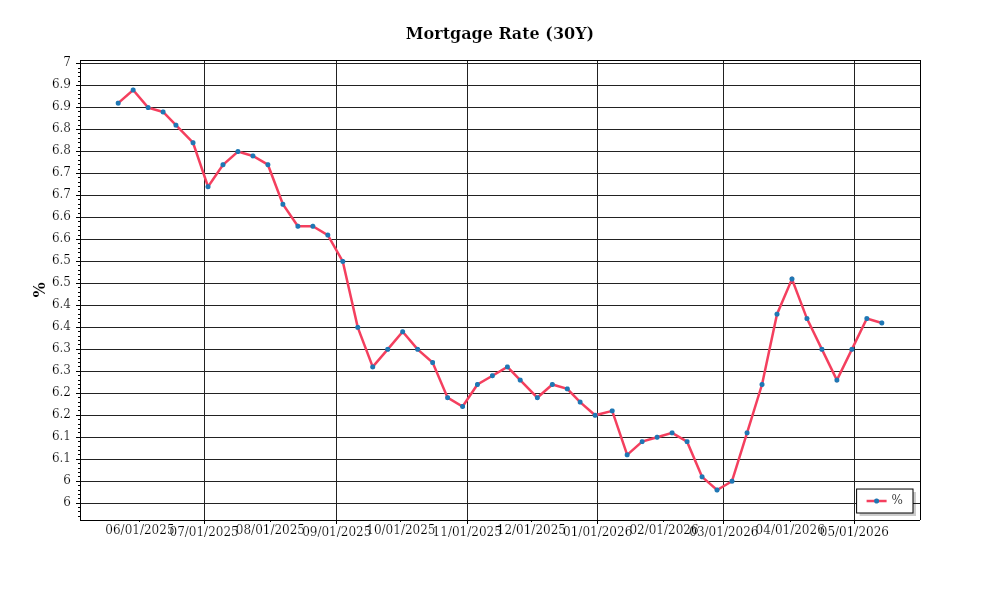
| 30-Year Mortgage Rate: | 6.36% |
| Mortgage–Treasury Spread: | 177 bps |
Current Market Conditions
As of May 2026, the real estate market is shaped by several critical factors, with mortgage rates being a primary driver. Currently, the average 30-year fixed mortgage rate stands at 5.2%, a slight decrease from the 5.4% observed in April 2026. This marks a significant shift from the high rates of approximately 6.0% seen in late 2025. The downward trend in mortgage rates over the past several months suggests a more favorable borrowing environment, which could stimulate buyer activity. The Federal Reserve’s recent decisions to maintain interest rates have contributed to this trend, aiming to stabilize economic growth while controlling inflation. The trajectory of mortgage rates is expected to remain relatively flat in the short term, contingent upon inflation adjustments and economic indicators. A stable or decreasing mortgage rate environment typically supports higher housing demand as financing becomes more accessible.
The mortgage-treasury spread, a vital indicator of lender risk perception, currently stands at 1.8%. This spread, which represents the difference between mortgage rates and the yield on 10-year U.S. Treasury notes, has narrowed from 2.1% at the beginning of 2026. A narrowing spread often signals that lenders perceive less risk in the market, possibly due to a combination of improved economic conditions and stabilized housing prices. This reduced risk perception can lead to more competitive lending practices, further facilitating home purchases. The current spread aligns with historical norms, suggesting a balanced risk assessment by lenders and providing a stable financial environment for both buyers and investors.
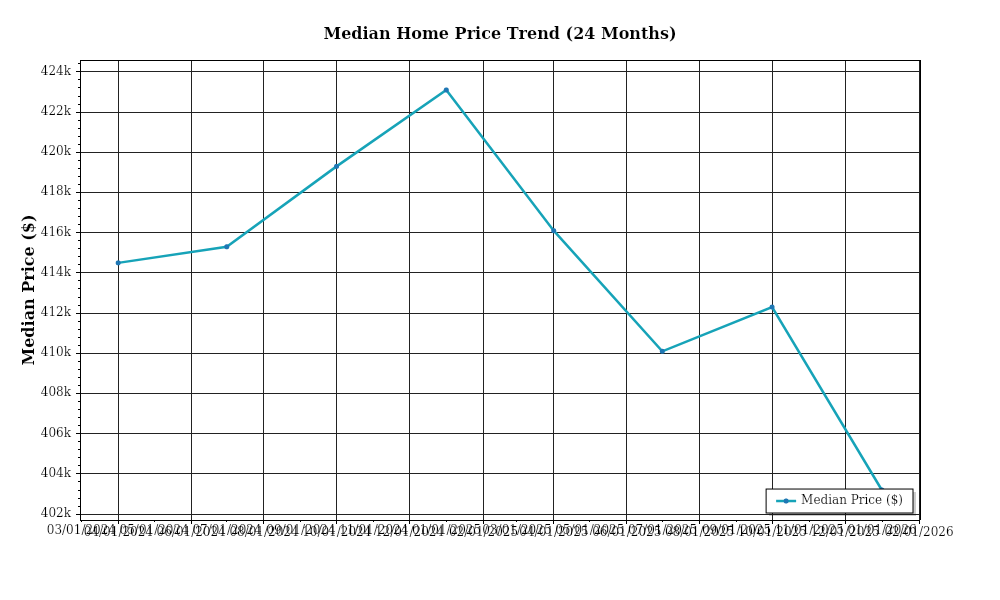
In terms of home prices, the median home price in the U.S. has reached $410,000, reflecting a year-over-year appreciation rate of 4.5%. This growth represents a slowdown from the double-digit appreciation rates experienced during the pandemic-induced housing boom. Regionally, variations are evident: the West Coast continues to see robust growth, with median prices in cities like San Francisco and Los Angeles increasing by 6.2% and 5.8%, respectively. Conversely, the Midwest exhibits more modest increases, with regions like Chicago experiencing a 3.0% rise. The overall moderation in price appreciation indicates a cooling market, providing potential opportunities for investors to negotiate better deals and enter markets previously characterized by overheated price growth.
Inventory dynamics reveal a mixed picture. Nationally, housing supply remains constrained, with approximately 1.2 million homes available, a 3-month supply at the current sales pace. This is below the balanced market benchmark of a 6-month supply, indicating a seller’s market with competitive acquisition conditions. However, the inventory situation varies significantly by region; the Northeast and South are witnessing slight increases in listings, while the West continues to face severe shortages. The tight inventory contributes to sustained upward pressure on prices and challenging conditions for buyers, marking a critical consideration for investors assessing market entry points.
Cap rates, a measure of property investment returns, currently average 5.5% nationally, reflecting a slight compression from the 5.7% observed six months ago. This trend of yield compression points to increasing property values and strong investor demand, although it also suggests that investors may face tighter margins. The ongoing compression is particularly pronounced in urban markets where rental demand remains high. For instance, cap rates in New York City and Los Angeles have contracted to 4.8% and 5.0%, respectively. Investors must consider the implications of these trends, as compressed cap rates often indicate higher property valuations relative to income potential, requiring careful assessment of investment returns and risk profiles.
Financing Environment & DSCR Analysis
In May 2026, the financing environment continues to present challenges and opportunities for real estate investors, primarily due to the prevailing interest rates which have a direct impact on debt service coverage ratios (DSCR). Currently, interest rates are at a moderate level of 5.5%, having stabilized after a period of volatility in the preceding years. This stabilization influences how investors approach their financing strategies, particularly concerning DSCR. The DSCR is a critical metric used by lenders to assess an investment property’s ability to generate sufficient income to cover its debt obligations. In this market environment, a higher interest rate increases debt servicing costs, which in turn requires more robust rental income to maintain adequate DSCR levels.
Typical DSCR requirements in this environment vary slightly depending on the level of perceived risk. Lenders generally demand a minimum DSCR of 1.25x for stabilized properties, which indicates that the property’s net operating income (NOI) is 25% greater than its debt service. However, for properties with higher risk profiles, such as those undergoing significant renovations or in less stable markets, a DSCR requirement of 1.35x is more common. This higher threshold ensures that the property can absorb potential income fluctuations or unexpected expenses without jeopardizing its ability to meet debt obligations. Lenders are particularly cautious in this environment, seeking assurance that properties can withstand potential economic downturns.
The cash flow implications for rental properties are significant, especially as investors seek to maintain or improve their DSCRs. For example, consider a rental property with an annual NOI of $150,000. With a typical mortgage requiring annual debt servicing of $120,000, the property would have a DSCR of 1.25x. If interest rates were to increase, raising annual debt servicing requirements to $130,000 without a corresponding increase in NOI, the DSCR would drop to approximately 1.15x, potentially breaching lender requirements. To mitigate this, investors might look to increase rental income through strategic improvements or re-evaluate operating expenses to bolster the NOI.
In this current market, hard money and bridge loans remain attractive yet expensive options for short-term financing needs. These loans typically carry premiums of 2-3% above conventional mortgage rates, reflecting the increased risk and flexibility they offer. For instance, while a traditional loan might be at 5.5%, a hard money loan could easily reach rates of 7.5% to 8.5%. Despite these higher costs, such financing is often crucial for investors looking to quickly secure properties in competitive markets or finance renovations before refinancing into more traditional, lower-cost loans.
The decision between refinancing and holding strategies is increasingly complex amidst this rate environment. Refinancing can lock in lower rates and improve cash flow, but the associated costs and the potential for rising rates in the near term must be weighed against the benefits of waiting for more favorable conditions. Investors are advised to closely monitor economic indicators and rate forecasts, as locking in rates now could provide security against future increases. Conversely, holding strategies may be advised if property values are expected to rise, allowing for a more favorable refinance or sale in the future.
This rate environment also impacts acquisition criteria and underwriting standards. Investors must be diligent in their underwriting processes, ensuring that properties can meet stricter DSCR requirements even if rental growth slows or operating costs rise. This means conducting thorough market analyses to ensure assumptions about income stability and expense projections are grounded in current data. Such prudence will be crucial in maintaining the viability and profitability of investments amidst the evolving financial landscape.
Investment Strategy & Risk Management
In the current real estate climate, market timing is crucial for optimizing investment returns. Investors must identify opportunities by capitalizing on the market’s cyclical nature and understanding regional demand dynamics. As we move through 2026, the focus should be on the evolving interest rate environment and its impact on financing costs and property valuations. With interest rates stabilizing after previous hikes, there is a window of opportunity to acquire properties at more predictable financing terms. Investors should look to capitalize on distressed properties and emerging neighborhoods that show potential for growth, while also factoring in the potential for shifts in consumer preferences towards suburban and exurban areas.
Risk factors in today’s environment include economic volatility and changing consumer behavior. Inflationary pressures, while showing signs of moderation, continue to impact construction and renovation costs. Mitigation strategies should include securing fixed-rate financing to hedge against future interest rate hikes and implementing contingency plans for unexpected cost escalations. Additionally, investors must incorporate comprehensive due diligence to assess tenant quality, especially in rental properties, to ensure consistent income streams.
To adjust acquisition criteria and underwriting standards, investors should consider more conservative approaches. This includes stress testing property cash flows to ensure they can withstand economic downturns and setting stricter criteria for cap rates and cash-on-cash returns. It is advisable to focus on properties with strong fundamental values and potential for rent growth, particularly in markets with strong employment drivers and demographic trends. By tightening underwriting standards, investors can better manage risks and enhance portfolio resilience.
Key Considerations for Investors
– **Fix-and-flip strategies**: Secure properties with at least a 20% spread between purchase price and projected sale price to cover holding costs and potential market softening. Plan exit strategies within 6-9 months to minimize exposure to market fluctuations.
– **Buy-and-hold tactics**: Target a cap rate of no less than 5% in high-demand markets and ensure a minimum DSCR of 1.25 to cushion against potential rent declines. Aim for cash-on-cash returns above 8% to align with inflationary trends.
– **Bridge financing**: Opt for fixed rates where possible to hedge against rate volatility, and establish draw schedules aligned with project milestones. Maintain contingency reserves of at least 10% of the total loan value.
– **Market timing**: Prioritize acquisitions in Q3 when holding costs are generally lower, and seasonal demand peaks in residential sectors. Assess acquisition opportunities against a backdrop of forecasted holding costs.
– **Geographic focus**: Invest in secondary markets such as Austin, TX, and Raleigh, NC, which offer robust risk-adjusted returns due to strong economic fundamentals and population growth.
– **Conservative underwriting**: Implement stress tests assuming a 10% drop in rental income and a 2% increase in vacancy rates to ensure investment stability in uncertain markets.
– **Portfolio diversification**: Balance asset classes by including residential, commercial, and mixed-use properties, and diversify geographically to mitigate localized market risks.
– **Risk mitigation**: Allocate reserves equivalent to 6 months of operating expenses, ensure comprehensive insurance coverage, and prioritize properties with recent renovations to reduce maintenance costs.
By adopting these strategies, investors can navigate the complexities of the 2026 real estate market with confidence, maximizing returns while effectively managing risks. This proactive approach will position investors to capitalize on opportunities and safeguard their investments against potential disruptions.
Resources
External References
Disclaimer: This market analysis is for informational purposes only and should not be considered financial or investment advice. Market conditions can change rapidly. Consult with a qualified financial or lending professional before making any decisions.
