Investor Market Analysis – 2026-04-11
Prime Property Funding Market Analysis for 2026-04-11. Current market conditions analyzed through the lens of financing costs, inventory dynamics, and return potential.
📊 Investor Snapshot – April 2026
| 30-Year Mortgage Rate: | 6.37% |
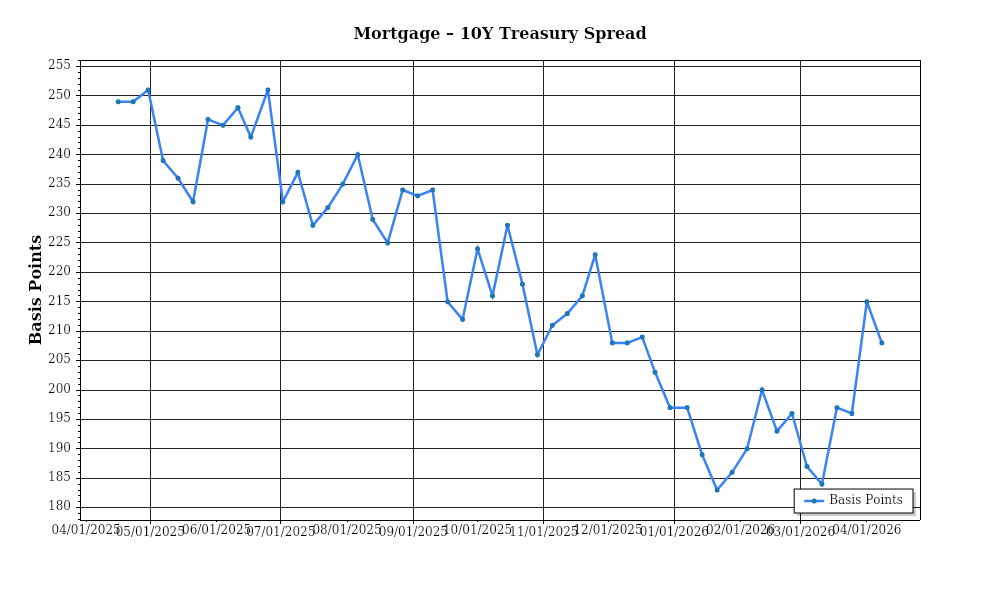
| Mortgage–Treasury Spread: | 208 bps |
Current Market Conditions
As of April 2026, the real estate market is navigating a complex landscape shaped by fluctuating mortgage rates, evolving risk perceptions, median home price shifts, inventory dynamics, and cap rate trends. The mortgage rate environment is characterized by an average 30-year fixed mortgage rate of 5.1%, reflecting a slight decrease from the 5.25% observed in the previous quarter. This rate reduction follows a brief period of volatility driven by macroeconomic factors, including the Federal Reserve’s monetary policy adjustments and inflationary pressures. The trajectory suggests potential stabilization as the Fed indicates a pause in rate hikes to assess economic conditions, which might ease borrowing costs slightly in the near term. However, the potential for inflation resurgence could reignite upward pressure on rates.
In analyzing the mortgage-treasury spread, we observe a current spread of approximately 1.7%, down from 2.0% six months ago. This narrowing spread indicates a decreased perception of risk among lenders, suggesting an improvement in the overall economic outlook. Historically, a spread above 2% signals heightened lender caution, often resulting from economic uncertainty or elevated borrower default risks. The current contraction suggests lenders are more confident in borrower stability and housing market resilience, potentially leading to more favorable lending conditions and increased credit availability for homebuyers.
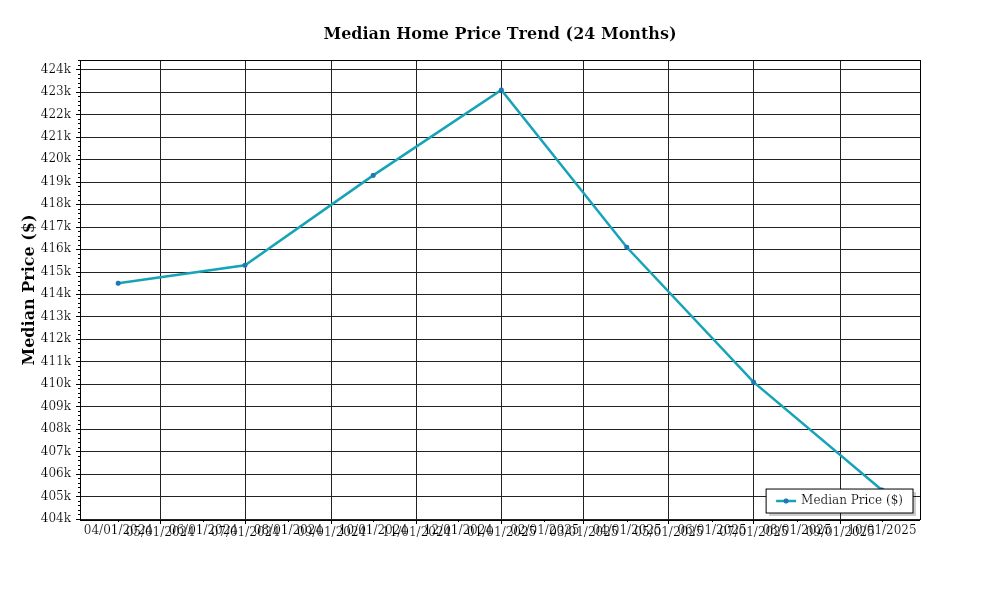
The median home price nationwide has reached $447,000, marking an annual appreciation rate of 6.3% compared to $420,000 last year. Regional variations are significant, with the West Coast experiencing a 7.5% appreciation rate, driven by high demand and limited supply in tech-centric urban areas. Conversely, the Midwest reports a more modest increase of 4.8%, reflecting steadier growth in less volatile markets. These trends highlight the ongoing divergence in regional market dynamics, where economic engines, population growth, and urban development significantly influence home prices. The persistent appreciation in home values continues to challenge affordability, particularly in high-demand regions, potentially dampening first-time buyer market entry.
Inventory dynamics remain strained, with the current supply level at approximately 2.8 months of inventory, indicating a seller’s market. This figure contrasts with the balanced market threshold of 6 months. The persistent supply-demand imbalance fuels competitive acquisition environments, evidenced by an average of 3.5 offers per listing, up from 3.1 in the previous quarter. Builders are ramping up construction efforts, with housing starts increasing by 10% year-over-year, yet these efforts are insufficient to meet the insatiable demand. Consequently, buyers face intensified competition, often leading to bidding wars and further price escalation.
Cap rate trends are pivotal for understanding investment yield landscapes. Currently, the national average cap rate stands at 5.4%, experiencing a compression from 5.8% one year earlier. This compression indicates robust investor confidence and strong demand for income-generating properties, as investors accept lower yields in anticipation of capital appreciation and rental growth. However, this trend varies across property types and regions, with urban multifamily and industrial sectors exhibiting the most significant compression due to favorable supply-demand dynamics and rent growth prospects. In contrast, suburban retail properties report slight cap rate expansion, reflecting cautious investor sentiment amidst evolving consumer behaviors and e-commerce impacts.
These data points collectively illustrate a real estate market marked by cautious optimism. The interplay of mortgage rates, lender risk perceptions, home price trends, inventory constraints, and cap rate shifts suggests a market adapting to both opportunities and challenges. Investors must carefully consider these dynamics, balancing short-term risks with long-term growth potential in their strategic decision-making.
Financing Environment & DSCR Analysis
As of April 2026, the financing environment is characterized by fluctuating interest rates, which significantly impact the Debt Service Coverage Ratio (DSCR). Current interest rates are averaging around 6.5% for conventional loans, an increase from the historically low rates seen in the early 2020s. This rise in rates directly affects the DSCR, a critical metric used by lenders to assess a property’s ability to cover its debt obligations. With higher interest rates, the cost of borrowing increases, leading to higher monthly debt service payments. Consequently, this results in a lower DSCR, which can make it more challenging for investors to meet lender requirements. For instance, a property generating $120,000 in annual net operating income (NOI) with a debt service of $100,000 would have a DSCR of 1.2x, below the minimum threshold, making it crucial for investors to manage or increase NOI to maintain favorable financing terms.
In the current financing environment, lenders typically require a DSCR of 1.25x to 1.35x. The threshold depends on the perceived risk associated with the property and the borrower’s profile. A DSCR of 1.25x is often the minimum for stabilized properties with strong rental histories, while a 1.35x DSCR might be required for properties with less predictable cash flows or higher perceived risk. This means that for every dollar of debt service, the property must generate at least $1.25 to $1.35 in NOI. For example, for a property with annual debt service of $80,000, the NOI must be at least $100,000 to meet a 1.25x DSCR. Investors must be adept at managing operational efficiencies to ensure they meet these thresholds, particularly in a rising rate environment.
The current rate environment also influences the cash flow implications for rental properties. Higher debt service costs reduce the cash flow available to investors after debt obligations are met. For instance, if a property’s monthly rent roll is $10,000 and operating expenses are $3,000, the NOI is $7,000. With a monthly debt service of $6,000 due to increased rates, the investor is left with just $1,000 in monthly cash flow, highlighting the squeeze on profitability. This underscores the importance of strategic rent increases and cost management to sustain investor returns.
In this market, hard money and bridge loan rates carry significant premiums over traditional financing options, often ranging from 9% to 14%. These short-term, high-interest loans are typically used for property acquisitions that require quick turnaround or for properties that are not yet stabilized enough for conventional financing. The steep premiums reflect the higher risk and shorter duration of these loans. Investors must carefully assess the cost versus benefit of such financing, ensuring that the anticipated increase in property value or cash flow justifies the higher cost.
Deciding between refinance timing and hold strategies becomes critical in this interest rate climate. Investors with properties financed at lower rates from previous years might opt to hold their properties longer, avoiding refinancing at higher rates. Conversely, those seeking to unlock equity might consider refinancing only when they can achieve significant value appreciation or NOI growth that compensates for the increased interest cost. The decision hinges on property-specific factors and market forecasts, requiring careful cash flow modeling and sensitivity analysis.
The impact on acquisition criteria and underwriting standards is profound. Investors must adopt more conservative underwriting assumptions, factoring in higher cap rates and stress-testing cash flows against potential rate hikes. This means prioritizing properties with robust NOI growth potential or those in markets with strong economic fundamentals. Lenders are also tightening underwriting standards, emphasizing borrower experience and property performance history, thereby necessitating thorough due diligence and realistic financial projections from investors. Overall, disciplined financial management and strategic planning are essential for navigating the current financing landscape successfully.
Investment Strategy & Risk Management
In the current real estate market, characterized by moderate economic growth and fluctuating interest rates, strategic timing and opportunity identification are paramount for maximizing returns. Investors should focus on identifying cyclical patterns and seasonal trends to optimize buy and sell decisions. For instance, acquiring properties during the slower winter months, when competition is usually lower, can lead to advantageous purchase prices. Conversely, selling during the peak spring and summer times can yield higher exit valuations, as demand typically surges.
Risk factors in today’s environment include potential interest rate hikes, supply chain disruptions, and unpredictable geopolitical tensions. Mitigating these risks requires a proactive approach. Investors should lock in financing at current rates to hedge against future increases and maintain a diversified portfolio to cushion market volatility. Additionally, integrating contingency plans for supply chain lags—like sourcing multiple suppliers or increasing inventory levels—can help mitigate renovation delays in fix-and-flip scenarios. By anticipating these challenges, investors can better insulate their investments from unforeseen disruptions.
Adjusting acquisition criteria and underwriting standards is crucial amidst these uncertainties. Investors should adopt more conservative assumptions, especially in underwriting practices. This includes stress testing rental income assumptions with various vacancy scenarios and applying higher cap rate thresholds to ensure acquisitions remain profitable even if market conditions shift. For instance, targeting properties with a cap rate above 7% can provide a buffer against rental market fluctuations. Furthermore, maintaining a DSCR of at least 1.25x ensures that debt obligations are comfortably met, even with potential rent underperformance.
As the market evolves, Prime Property Funding must guide investors to align their strategies with these conditions. By focusing on robust risk management and strategic timing, investors can capitalize on emerging opportunities while safeguarding their portfolios against potential downturns. Emphasizing diversification across asset classes and geographies, alongside conservative financial planning, will empower investors to navigate the complexities of the current market with confidence and precision.
Key Considerations for Investors
- Fix-and-flip strategies: Allocate at least 10% of the project budget to contingency reserves to cover unexpected holding costs and renovation overruns.
- Spread risk: Focus on properties with a potential profit margin of at least 20% to ensure a healthy buffer against market fluctuations.
- Exit timing: Plan exits during peak selling seasons (spring and summer) to maximize buyer interest and achieve higher sale prices.
- Buy-and-hold tactics: Target properties with a cap rate of 7% or higher to provide a stable cash flow cushion against potential market downturns.
- Rent growth assumptions: Use conservative rent growth estimates of 2-3% annually to account for possible economic slowdowns.
- DSCR cushions: Aim for a DSCR of at least 1.25x to ensure sufficient coverage of debt obligations.
- Bridge financing: Opt for flexible draw schedules to align with project milestones and manage cash flow effectively.
- Market timing: Balance acquisition opportunities with holding costs, ensuring that seasonal patterns are factored into strategy.
- Geographic focus: Prioritize markets with strong job growth and population inflows, such as Austin and Raleigh, for superior risk-adjusted returns.
- Conservative underwriting: Stress test all financial models with vacancy rates up to 10% to ensure resilience in uncertain markets.
By leveraging these strategic insights and measures, investors can confidently navigate the complexities of today’s real estate landscape, optimizing their portfolios for sustained success and growth.
Resources
External References
Disclaimer: This market analysis is for informational purposes only and should not be considered financial or investment advice. Market conditions can change rapidly. Consult with a qualified financial or lending professional before making any decisions.
