Investor Market Analysis – 2026-03-22
Prime Property Funding Market Analysis for 2026-03-22. Current market conditions analyzed through the lens of financing costs, inventory dynamics, and return potential.
📊 Investor Snapshot – March 2026
| 30-Year Mortgage Rate: | 6.22% |
| Mortgage–Treasury Spread: | 197 bps |
Current Market Conditions
As of March 2026, the mortgage rate environment reflects a nuanced landscape shaped by macroeconomic factors and recent policy shifts. Currently, the average 30-year fixed mortgage rate stands at 5.75%, a noticeable increase from 4.5% in March 2025. This upward trajectory aligns with the Federal Reserve’s ongoing interest rate hikes aimed at curbing inflation, which has persisted above the Fed’s target range of 2% for over a year. These rate increases have led to a tightening of lending conditions, thereby impacting borrower affordability and dampening housing demand. The 15-year fixed mortgage rate has similarly risen, now averaging 5.0%, compared to 3.8% a year ago. This trend suggests continued upward pressure on mortgage rates as the Federal Reserve prioritizes inflation control over economic expansion.
The mortgage-treasury spread, a critical indicator of lender risk perception, currently hovers around 200 basis points. This spread has widened from 160 basis points in the previous year, signaling a heightened risk aversion among lenders. The spread indicates the premium that lenders require over risk-free treasuries to compensate for perceived risks in mortgage lending. A spread exceeding 200 basis points typically suggests lenders are wary of economic uncertainties, possibly stemming from volatile employment figures and geopolitical tensions. This increased risk perception can lead to stricter lending standards, further constraining buyer access to credit and potentially slowing down the housing market’s momentum.
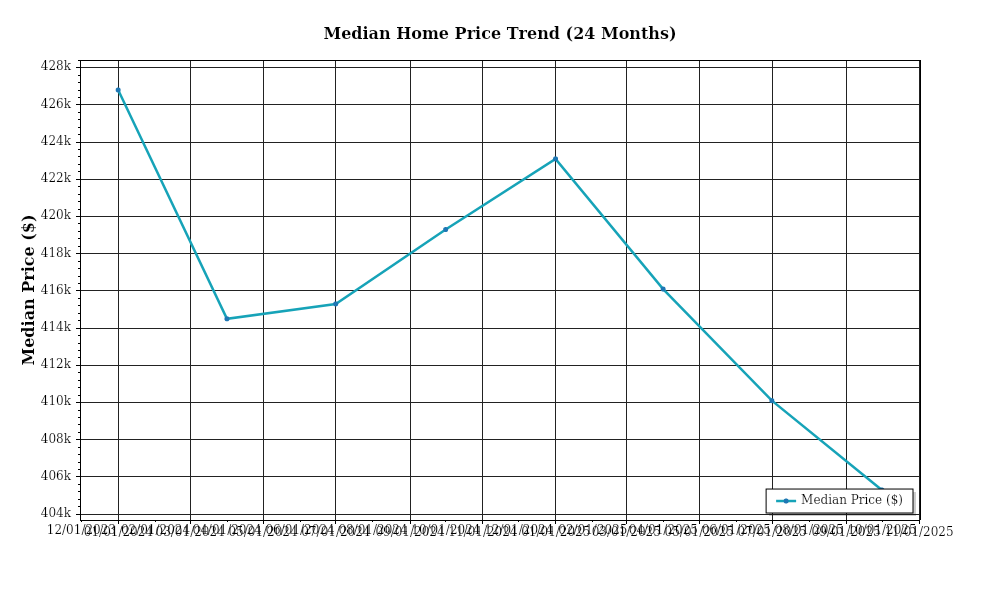
In terms of median home price trends, the national median home price has reached $450,000, representing a 4.5% year-over-year increase. This growth rate, while positive, marks a deceleration from the robust 10% appreciation observed in the previous year, reflecting the impact of higher mortgage rates on buyer affordability. Regional variations persist, with the Midwest experiencing a modest 3% increase in median prices, while the West Coast continues to see stronger appreciation at 6%, driven by sustained demand in tech-centric urban areas. These regional disparities highlight the importance of localized market dynamics, where factors such as employment growth, housing supply, and demographic shifts play pivotal roles.
Inventory dynamics remain a crucial determinant of market balance. The current inventory level stands at 1.5 million homes, translating to a 3-month supply, which is below the balanced market threshold of 6 months. This limited supply creates a competitive environment, particularly in metropolitan areas where buyer demand outpaces available listings. New construction has been slow to bridge this gap, with recent building permits and housing starts data showing only a 2% year-over-year increase. This sluggish pace of new supply exacerbates the competition for acquisitions and sustains upward pressure on home prices, despite the cooling effect of higher mortgage rates.
Cap rate trends provide further insights into the real estate investment landscape. As of March 2026, cap rates for multifamily properties average 5.2%, a slight increase from 4.9% twelve months prior. This increase suggests a trend of yield expansion, as rising interest rates make alternative investments more attractive, prompting investors to demand higher returns from real estate assets. However, in prime markets such as New York and San Francisco, cap rates remain compressed at 4.0%, reflecting ongoing investor confidence in the long-term appreciation potential of these areas. The divergence in cap rate trends underscores the differential impact of macroeconomic factors on core versus non-core markets, with implications for investment strategy and portfolio diversification.
Financing Environment & DSCR Analysis
In March 2026, the financing environment is characterized by relatively high interest rates, which significantly influence the Debt Service Coverage Ratios (DSCR). Current interest rates hover around 7%, a substantial increase from the historically low rates seen in the preceding decade. This rise impacts DSCR as higher borrowing costs increase the principal and interest payments required on loans, thus affecting the ratio of net operating income (NOI) to debt obligations. For instance, a rental property generating $100,000 in NOI with a $75,000 annual debt service would have a DSCR of 1.33x at a 5% interest rate. However, with the rate climbing to 7%, the annual debt service might rise to $85,000, reducing the DSCR to 1.18x, below the acceptable threshold for many lenders.
In this environment, lenders typically require more stringent DSCR thresholds for financing approval. The prevailing standard has shifted from a 1.25x to a 1.35x ratio, making it more challenging for investors to secure financing. This requirement ensures that properties generate sufficient cash flow to cover debt obligations even under stressed conditions. For example, with a DSCR requirement of 1.35x, a property must generate $135,000 in NOI to support a $100,000 debt service. Investors must therefore either seek properties with higher income potential or negotiate better financing terms to meet these criteria. This shift demands a more thorough examination of property performance and realistic income projections during the underwriting process.
For rental properties, the cash flow implications are significant. Higher DSCR requirements and interest rates mean that properties must generate more revenue to sustain the same level of leverage. For instance, consider a multifamily property initially valued at $2 million, with a 75% loan-to-value (LTV) ratio. At 5% interest, the annual debt service might be $90,000, necessitating an NOI of $112,500 to meet a 1.25x DSCR. With interest rates at 7%, the annual debt service increases to $110,000, necessitating an NOI of $148,500 to achieve a 1.35x DSCR. This scenario underscores the importance of rigorous market analysis and the potential need for rent increases or operational efficiencies to maintain positive cash flow.
The current market also affects the premiums on hard money and bridge loans. These short-term, high-interest loans are typically sought by investors for quick acquisitions or property rehabs. In 2026, the rates for these loans can range from 10% to 15%, reflecting the increased risk and cost of capital. This rate environment necessitates careful consideration of the project’s timeline and exit strategy, as the cost of capital can significantly erode profitability if the property is not stabilized or refinanced promptly.
Given the high interest rates, investors face critical decisions regarding refinance timing versus hold strategies. Refinancing may offer a chance to lock in a lower rate if market conditions improve, but this is contingent on the property meeting stricter DSCR requirements. Conversely, a hold strategy might be prudent if rates are expected to decline, allowing for potential value appreciation before refinancing. This decision should integrate forecasts of interest rate trends and property market conditions, emphasizing the need for flexibility in investment strategies.
Lastly, the current rate environment impacts acquisition criteria and underwriting standards. Investors must be more conservative in their assumptions, focusing on properties with strong income streams and less reliance on speculative appreciation. Underwriting standards now emphasize a thorough analysis of current and projected cash flows, ensuring properties can withstand interest rate fluctuations and meet heightened DSCR requirements. This prudent approach helps mitigate risk and ensures long-term financial viability in an increasingly challenging financing landscape.
## Investment Strategy & Risk Management
In the current market environment of March 2026, timing is critical for maximizing returns on real estate investments. The cyclical nature of real estate suggests that investors who are adept at identifying opportunities during market fluctuations can gain a competitive edge. Given the recent stabilization of interest rates, a window has emerged for strategic acquisitions, particularly in markets that are beginning to show signs of recovery after a period of stagnation. Prime Property Funding, with its suite of financing options, is well-positioned to capitalize on these emerging opportunities by offering tailored solutions that meet the specific needs of investors, whether they’re engaged in fix-and-flip projects or long-term buy-and-hold strategies.
Risk factors in the current environment include potential economic slowdowns, fluctuating interest rates, and regional regulatory changes. To mitigate these, investors should implement robust contingency planning and maintain a diversified portfolio. Stress testing financial models against potential downturns will ensure resilience. Ensuring liquidity through adequate reserves and employing flexible exit strategies, such as lease-to-own options or short-term rentals, can provide a cushion against unforeseen market shifts.
Adjusting acquisition criteria is essential in this nuanced landscape. Investors should prioritize properties with strong fundamentals in markets exhibiting stable or growing rental demand. Underwriting standards must account for realistic rent growth projections and conservative cap rate assumptions. Implementing a margin of safety in cash flow analyses, such as a minimum Debt Service Coverage Ratio (DSCR) of 1.25, can safeguard against underperformance.
In conclusion, while risks are inherent, they can be effectively managed with careful planning and strategic execution. By focusing on data-driven decisions and maintaining flexibility in investment strategies, investors can navigate the complexities of the 2026 real estate market with confidence. Prime Property Funding’s comprehensive financing solutions play a crucial role in facilitating these strategies, empowering investors to seize opportunities and mitigate risks effectively.
### Key Considerations for Investors
– **Fix-and-flip strategies**: Ensure holding costs do not exceed **6 months** to mitigate exposure to market fluctuations. Maintain a **minimum profit margin of 20%** to buffer against unexpected expenses.
– **Buy-and-hold tactics**: Target properties with a **cap rate of at least 6%** in emerging neighborhoods. Assume a **rent growth rate of 3%** annually to stay conservative in projections.
– **Bridge financing**: Secure loans with flexible **draw schedules** to match project timelines. Allocate **10% of total project costs** as contingency reserves to address unforeseen expenses.
– **Market timing**: Focus on acquisitions during **off-peak seasons** (e.g., winter months) to minimize competition and negotiate better deals.
– **Geographic focus**: Identify secondary markets, such as **Austin, TX** and **Raleigh, NC**, which currently offer superior risk-adjusted returns due to tech industry growth.
– **Conservative underwriting**: Stress test investment models with a **10% vacancy rate** and **interest rate hikes of 1%** to ensure robustness under adverse conditions.
– **Portfolio diversification**: Balance holdings across **at least three different asset classes** and **five geographic regions** to minimize exposure to localized downturns.
– **Risk mitigation**: Maintain **cash reserves covering 6 months of expenses** and invest in comprehensive insurance policies. Prioritize properties with **high tenant quality** to reduce turnover.
– **Exit strategies**: Develop multiple exit plans, including **selling, refinancing, or converting to short-term rentals**, to maintain flexibility and adaptability in dynamic markets.
By implementing these strategies and maintaining vigilance, investors can confidently navigate the complexities of the current market, maximize returns, and achieve sustained growth.
Resources
External References
Disclaimer: This market analysis is for informational purposes only and should not be considered financial or investment advice. Market conditions can change rapidly. Consult with a qualified financial or lending professional before making any decisions.
