Investor Market Analysis – 2026-03-12
Prime Property Funding Market Analysis for 2026-03-12. Current market conditions analyzed through the lens of financing costs, inventory dynamics, and return potential.
📊 Investor Snapshot – March 2026
| 30-Year Mortgage Rate: | 6.00% |
| Mortgage–Treasury Spread: | 185 bps |
Current Market Conditions
As of March 2026, the mortgage rate environment remains a pivotal factor influencing the real estate market. Currently, the average 30-year fixed mortgage rate stands at 5.75%, reflecting an increase from the 4.90% rate recorded in March 2025. This upward trend, which has been consistent over the past 12 months, can largely be attributed to the Federal Reserve’s monetary tightening policies aimed at curbing inflation. The Federal Open Market Committee has incrementally raised the federal funds rate by 75 basis points since January 2026, influencing borrowing costs across the board. Analysts forecast that mortgage rates may stabilize around the 6.00% mark by the end of 2026 if inflationary pressures ease and economic growth stabilizes.
The mortgage-treasury spread, a key indicator of lender risk perception, is currently at 180 basis points, slightly above the historical average of 150 basis points. This widening spread suggests heightened caution among lenders, possibly due to increased economic uncertainty and potential defaults. The spread has grown from 160 basis points in March 2025, reflecting lenders’ concerns over the macroeconomic outlook, including geopolitical tensions and the potential for a slowdown in global economic growth. A wider spread typically indicates that lenders are demanding higher premiums for perceived risks, which may lead to tighter credit conditions and higher borrowing costs for consumers.
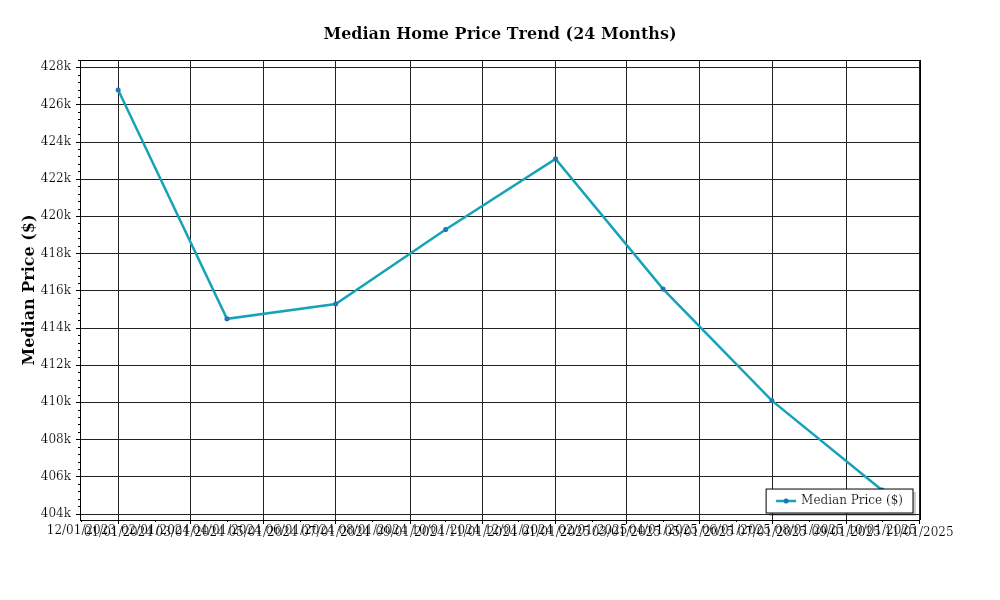
In terms of home prices, the median national home price is currently $375,000, marking a 5.8% year-over-year increase from March 2025. This figure represents a deceleration compared to the 8.2% appreciation rate seen in the previous year, suggesting a cooling market. Regionally, price changes vary significantly: the Midwest has experienced a modest growth rate of 3.2%, whereas the West Coast markets, particularly in cities like San Francisco and Seattle, have seen a decline of 2.5% due to affordability challenges and tech sector volatility. Conversely, the Southeast, especially in cities such as Charlotte and Atlanta, continues to see robust growth, with median prices up by 7.4% year-over-year.
Inventory levels also paint a dynamic picture of the current market. Nationally, the housing supply has increased to 3.8 months of inventory, up from 2.7 months a year ago, indicating a shift towards a more balanced market. This increase in supply can be attributed to a combination of new construction projects reaching completion and a rise in homeowners opting to list their properties amidst favorable selling conditions. Despite this uptick, certain urban markets remain highly competitive. In areas like Austin and Nashville, the inventory is still below 2.5 months, suggesting persistent demand and a seller’s market. This competitive landscape is further intensified by continued population growth and corporate relocations in these regions.
Cap rates, which measure real estate investment returns, have shown signs of compression across several asset classes. The average cap rate for multifamily properties is currently at 4.5%, down from 5.0% in March 2025. This trend indicates strong investor demand, driving prices higher and yields lower. In contrast, office spaces have seen cap rates expand to 6.8%, up from 6.5% a year ago, reflecting ongoing uncertainty regarding the future of hybrid work models and office space utilization. Retail properties, particularly those in suburban areas, maintain stable cap rates around 6.0%, benefiting from the resurgence in consumer spending and the adaptation of retailers to e-commerce trends.
These market conditions collectively suggest a period of cautious optimism. While rising mortgage rates and lender risk perceptions signal potential headwinds, the underlying demand for housing, coupled with strategic shifts in market dynamics, presents nuanced opportunities for discerning investors. The interplay of regional variations, inventory adjustments, and cap rate trends will be critical in shaping investment strategies moving forward.
Financing Environment & DSCR Analysis
In March 2026, the financing environment remains complex, shaped by both macroeconomic trends and lender-specific criteria. Interest rates, which have stabilized around 5.5% for conventional 30-year fixed-rate mortgages, significantly influence the Debt Service Coverage Ratio (DSCR), a crucial metric for assessing a property’s ability to cover its debt obligations. Higher interest rates increase borrowing costs, thus elevating the debt service payments and tightening the cash flow margins as rental income must now cover higher financing costs. For instance, if a rental property generates $120,000 annually, a 5.5% interest rate on a $1 million mortgage translates to approximately $68,400 in annual debt service, yielding a DSCR of 1.75x. However, a modest increase in rates can quickly compress this ratio to marginal levels, underscoring the importance of interest rate vigilance in investment strategies.
In this environment, lenders have maintained stringent DSCR requirements to mitigate risk. The typical threshold for DSCR now hovers between 1.25x and 1.35x. While a 1.25x DSCR might suffice for properties with stable, high-demand rental streams, the prevailing preference leans towards the 1.35x mark, particularly for properties with variable cash flows or in less mature markets. This higher threshold reflects lenders’ cautious approach, ensuring a buffer against potential income disruptions. For example, a property with a 1.35x DSCR requirement must generate $135,000 in net operating income (NOI) to support $100,000 in debt service, limiting the borrower’s leverage and potentially impacting the property’s valuation and acquisition price.
The implications for cash flow are significant, particularly for rental properties. Let’s consider a multi-family property with an annual NOI of $200,000 and subject to a 5.5% interest rate on a $1.5 million loan. The annual debt service would approximate $102,600, resulting in a DSCR of roughly 1.95x. This scenario provides a comfortable cushion, yet if interest rates were to rise by just 0.5%, the debt service would increase to $110,400, reducing the DSCR to 1.81x and cutting the available cash flow. Investors must thus prioritize interest rate forecasts in their cash flow models, preparing for potential rate hikes by either improving operational efficiencies to boost NOI or adjusting their leverage strategies.
In contrast, hard money and bridge loans carry substantial rate premiums, typically 8-12%, reflecting their short-term, high-risk nature. These loans serve as pivotal tools for investors needing quick capital without the stringent underwriting of conventional loans. However, their higher costs necessitate a clear exit strategy, often through refinancing or property sale, to avoid long-term financial strain. For instance, a bridge loan at 10% on a $500,000 acquisition entails $50,000 in annual interest—significantly impacting cash flow and necessitating rapid value-add actions to justify the cost.
The current rate environment prompts investors to weigh refinance timing versus hold strategies judiciously. With stable to potentially rising rates, refinancing to lock in long-term debt at current rates appears attractive. However, this must be balanced against prepayment penalties and the anticipated future interest rate trajectory. Investors with properties nearing loan maturity face critical decisions: refinance now to secure predictable costs or wait, risking higher future rates but possibly benefiting from improved market conditions or property values.
Finally, the rate environment influences acquisition criteria and underwriting standards. Investors are increasingly prioritizing properties with robust cash flows and potential for rent escalation, thereby aligning with stricter DSCR requirements. Underwriting standards now incorporate stress tests for interest rate increases, ensuring properties can sustain higher debt service without compromising financial stability. This has led to greater scrutiny of income projections and expense assumptions, with a preference for assets in strong, growing markets with demonstrated rental demand and occupancy stability.
Investment Strategy & Risk Management
In the current real estate climate of March 2026, strategic market timing and opportunity identification are paramount for maximizing investment returns. With economic indicators signaling a period of moderate growth, investors should be prepared to capitalize on fluctuating conditions. The housing market continues to experience modest price appreciation, making it crucial to identify undervalued properties in emerging neighborhoods. Seasonality also plays a significant role; historically, the spring and summer months see heightened activity, presenting opportunities for acquisitions. However, savvy investors should also consider off-peak months to secure better deals, as competition diminishes.
Key risk factors in today’s environment include interest rate volatility and potential regulatory changes. Recent Federal Reserve decisions suggest a stabilized rate environment, but investors should remain vigilant. Fluctuating rates could impact financing costs, affecting the profitability of projects, particularly in fix-and-flip strategies. To mitigate these risks, investors should lock in favorable rates and consider rate hedging products. Additionally, regulatory shifts, such as zoning laws and environmental regulations, require constant monitoring. Engaging with local real estate experts and legal advisors can help navigate these complexities effectively.
Adjusting acquisition criteria and underwriting standards is essential to maintain a competitive edge. In response to current market dynamics, investors should adopt a conservative approach by stress-testing financial models against various scenarios, including price declines and rent stagnation. Emphasizing properties with strong cash flow and high demand resilience will safeguard against market fluctuations. For fix-and-flip investments, prioritize properties with a low acquisition to after-repair value (ARV) ratio, ideally below 70%. For buy-and-hold strategies, target properties with cap rates above 6% to ensure a healthy return cushion.
In conclusion, Prime Property Funding can empower investors by offering tailored financing solutions that align with these strategic insights. By adhering to disciplined risk management practices and adjusting strategies to leverage current market dynamics, investors can optimize their portfolios for long-term success.
Key Considerations for Investors
- Fix-and-flip strategies: Aim for a holding period of no more than 6 months to minimize holding costs. Ensure a profit spread of at least 15% over total project costs to buffer against unforeseen expenses.
- Buy-and-hold tactics: Target properties with a minimum cap rate of 6% to ensure sufficient cash flow. Incorporate a rent growth assumption of at least 3% annually to offset inflation and maintain DSCR above 1.25x.
- Bridge financing: Leverage current rates by securing fixed-rate bridge loans. Establish draw schedules that align with project timelines to optimize cash flow management.
- Market timing: Consider acquiring properties in Q4, when competition is traditionally lower, potentially reducing acquisition costs by 5-10%.
- Geographic focus: Prioritize markets like Austin, Nashville, and Raleigh, where strong population growth supports robust risk-adjusted returns.
- Conservative underwriting: Stress test models with a 10% price decline scenario to ensure financial resilience.
- Portfolio diversification: Balance investments across residential, commercial, and industrial properties to mitigate sector-specific risks.
- Risk mitigation: Maintain contingency reserves equal to 6 months of operating expenses to safeguard against unexpected disruptions.
- Insurance: Ensure comprehensive coverage, including liability and natural disaster insurance, to protect asset value.
- Tenant quality: Implement rigorous screening processes to maintain high occupancy rates and reduce turnover costs.
Taking these strategic steps will empower investors to navigate the current landscape confidently, optimizing returns while minimizing exposure to potential risks.
Resources
External References
Disclaimer: This market analysis is for informational purposes only and should not be considered financial or investment advice. Market conditions can change rapidly. Consult with a qualified financial or lending professional before making any decisions.
